Patchwork Nation
If you pay attention to complexity of the USA its diversity and differences you soon realize that the ways we try to understand it – red and blue, Northeast and Midwest – are too simplistic. They are inadequate and misleading.
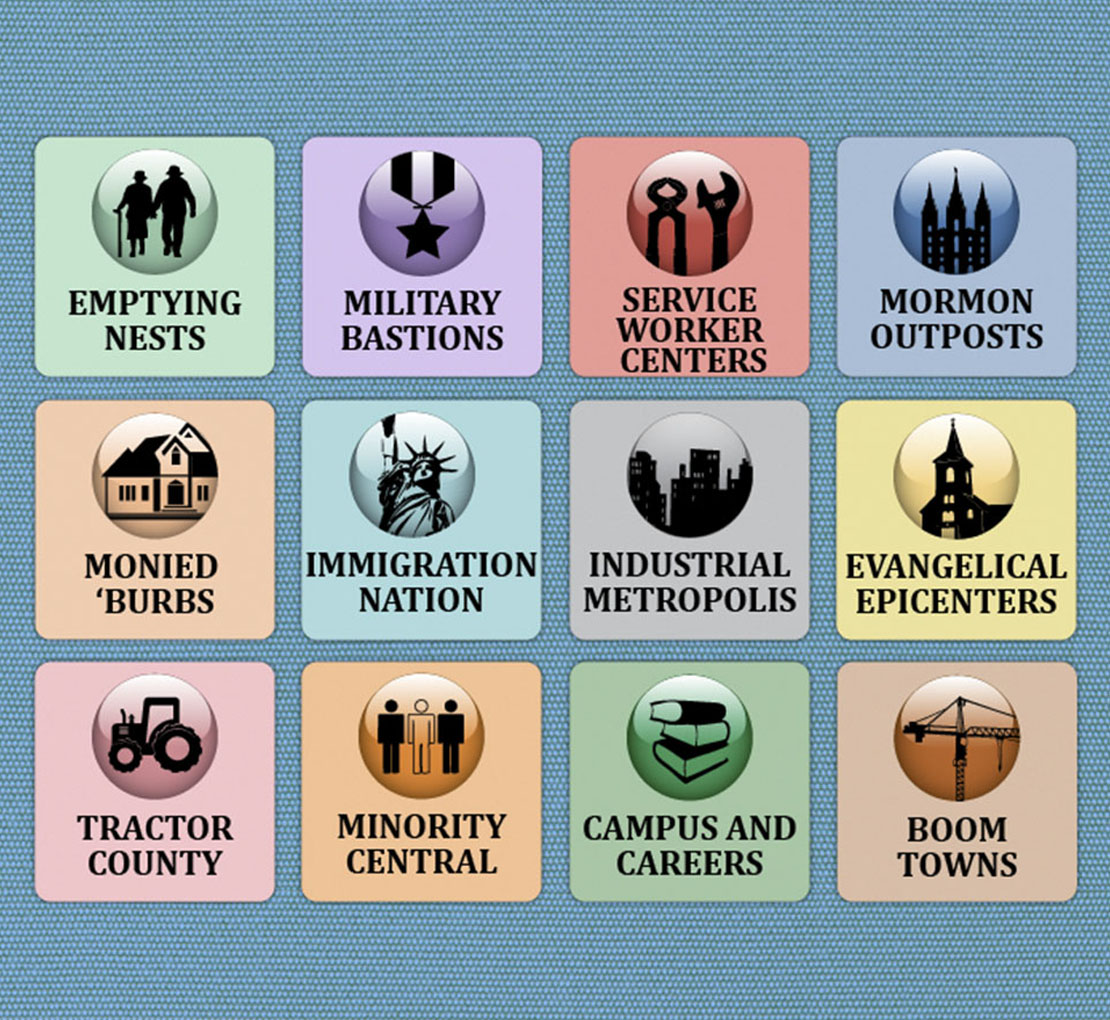
Patchwork Nation is a demographic/geographic breakdown of the nation into 12 different kinds of communities. Using counties as building blocks, we have identified different kinds of places – everything from rural agricultural areas to the wealthy suburban places, which we use to examine how various kinds of communities experience culture, the economy and politics. You can read more on the project methodology page.

Patchwork Nation makes open data easy. It delivers national data with local context while remaining visually intuitive for the reader. The interactive map helps break down national data to analyze how it impacts communities. We put data in the hands of the user, allowing him or her to compare different data sets and explore national data county-by-county.
Launched to cover the 2008 election and originally developed and hosted with the Christian Science Monitor, Patchwork Nation has evolved to cover more communities and more topics, focusing on the economy and culture as well as politics. The project represents an unprecedented collaboration of the Jefferson Institute with the Wall Street Journal, the News Hour, the Christian Science Monitor and WNYC Radio as well as local public broadcasting stations.